RTS Partners with Oxy to Present a Novel Approach to In-Facility Tubing Inspection at the SWPSC
Improved Well Analysis from Depth-Based Tubing Inspection Performed in a Facility
Abstract
The installation of tubing in a well makes it susceptible to wall loss from corrosion and wear. This degradation is influenced by environmental conditions, such as temperature, pressure, corrosiveness, and flow rates, along with operating factors like the type of artificial lift and well deviation. Periodic evaluation of tubing condition throughout the well’s operational life, using non-destructive testing (NDT) methods, is a recognized best practice. Common NDT methods include ‘scanning’ tubing at the wellhead during a workover or transporting tubing to a specialized facility for comprehensive inspection. The inspection equipment, whether used at the wellhead or in a facility, typically incorporates electromagnetic inspection (EMI) technology to identify defects and assess the tubing’s suitability for continued use. Wellhead and in-facility inspection methods each offer distinct advantages. However, our recent trials demonstrated that in-facility inspections can integrate some benefits traditionally exclusive to wellhead scanning. This development enhances the overall merits of in-facility inspections, establishing it as the preferred method.
Historically, tubing inspections performed at a facility did not capture the data benefits associated with a depth-correlated inspection enabled by wellhead scanning. An innovative approach adopted to bridge this data gap incorporated a systematic numbering system implemented as tubing is laid down prior to transport to the inspection facility. Once the tubing has been inspected at the facility, the inspection results of each joint are digitally rearranged according to the order they were pulled from the well. The result is a simulated depth-based inspection where the data is then used to create a well profile. This useful graphical tool aids in downhole troubleshooting, failure analysis, and design optimization.
In addition to the depth-based benefit that is now equalized between both inspection methods, further advantages of in-facility inspections have been obtained. The potential limitations in quality and comprehensiveness due to environmental factors of wellhead scanning conducted during well interventions will be explained. Alternatively, in-facility inspection occurs in a controlled setting under optimal conditions. This allows for comprehensive end-to-end examinations, incorporating EMI and additional inspection techniques. Such thorough assessments are pivotal in detecting subtle yet critical tubing imperfections, enabling a more comprehensive evaluation of tubing integrity. This approach not only enhances the detection of current issues but also facilitates the development of proactive maintenance strategies and well design improvements.
A thorough inspection at the facility with depth correlation provides accurate data to adjust well design and operation. This has led to an increase in both well run time and material recovery when tubing is inspected following these changes. The details of this process and the impact of this practice on well performance will be discussed.
Introduction
The integrity of production tubing installed in an oil and gas well is a critical component in performance and longevity of an asset. Standard well operations can lead to varying amounts of metal loss in this tubing commonly due to environmental or mechanical factors. The severity of material loss is influenced by flow rates, production method, fluid make up, and wellbore deviation. When a well intervention takes place, it is often desirable and common practice to perform a thorough evaluation of the remaining tubing wall thickness to determine if the joint is fit for service prior to redeployment. The industry standard for measuring metal loss typically incorporates some form of electromagnetic inspection (EMI) either implemented at the wellsite during well maintenance procedures or when tubing is transported to a specialized facility. Either wellsite or in-facility inspection methods can provide quantitative data regarding the wall thickness remaining in the tubing joint, which ultimately is the primary consideration when installing material again. API RP 5C1, Recommended Practice for Care and Use of Casing and Tubing, categorizes wall loss results into four color bands based on the remaining wall thickness measured (see Table 1). Several factors such as well depth, produced fluid properties, production rate, and well economics influence the decision on how tubing is inspected and what color band is reusable.
| Class | Color Band | Loss of Nominal Wall Thickness (percent) | Remaining Wall Thickness (percent minimum) |
|---|---|---|---|
| 2 | Yellow | 0 – 15 | 85 |
| 3 | Blue | 16 – 30 | 70 |
| 4 | Green | 31 – 50 | 50 |
| 5 | Red | Over 50 | less than 50 |
Table 1 – Classification and Color Coding of Used Casing and Tubing (API RP 5C1).
There are distinct advantages in ‘scanning’ tubing at the wellsite and sending assets into a facility. Both inspection methods were investigated in order to validate accuracy and establish operational best practices for their tubing program. Applying a novel approach to in-facility inspection allowed for depth-correlated analysis formerly exclusive to tubing scanning and the details of this process will be further discussed.
Principles of Electromagnetic Inspection
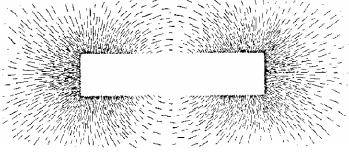
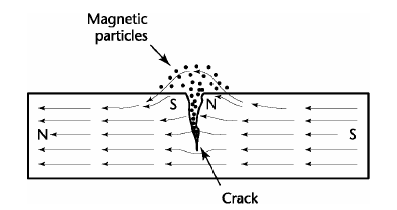
Inspection equipment including EMI will typically measure magnetic flux leakage (MFL) to identify discontinuities in the tubing joint as a result of wear or corrosion. In order to quantify this value, the material must first pass through an electromagnetic coil to magnetize the object. When free of discontinuities, the magnetic flux path only exits and re-enters the joint at the poles formed, creating a magnetic field surrounding the tubing similar to that of a bar magnet (see Figure 1). Once a defect occurs, additional magnetic poles are created on each side, allowing for magnetic flux to leak from the joint where it can be detected in multiple ways. The poles created on either side of a crack result in MFL exiting and re-entering the tubing (see Figure 2).
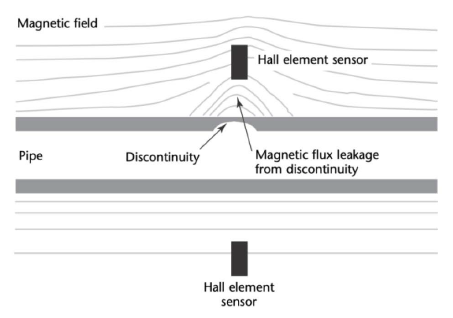
Hall-effect sensors are a way of measuring the strength of the magnetic field generated by a discontinuity (see Figure 3). Arranging multiple sensors in a ring around or in contact with the outside diameter of the tubing provides full coverage of the joint surface. The strength of the magnetic field caused by a defect is dependent on the shape, orientation relative to the magnetic field, and the magnetization level of the tubing. Material loss that is perpendicular to the flow of magnetic flux will produce a stronger signal than that occurring parallel or longitudinally. EMI equipment is manufactured with these principles in mind and allows a trained inspector to interpret indications as varying levels of wall loss. Proper maintenance and calibration of this equipment is a critical component in producing quality tubing measurements.
Wellsite Tubing Inspection
The majority of tubing scanned at the wellhead uses equipment that functions solely off EMI. This system uses over one hundred high resolution non-contact Hall-effect sensors to provide six distinct functional measurements. These sensors fully encircle the tubing as it is pulled through the inspection unit to provide separate indications for internal and external corrosion, flaws, body wall wear, tubing split detection, and cross-sectional area. This equipment identifies these changes in the tubing body of the joint but is not able to capture the last twelve to eighteen inches on either end due to the change in material thickness at the connection. The MFL created from tubing body defects are translated into an electrical signal that can be interpreted graphically via computer display to determine wall thickness loss. It is a recommended best practice that the inspection operator obtain training by the equipment manufacturer along with on-site apprenticeship with an experienced operator in order to properly classify tubing based on the generated charts. As an additional best practice, the size of the inspection head being used should match that of the material being analyzed.
Because tubing is pulled in sequence while scanning, the ability to correlate joint condition to depth is a significant advantage of wellsite inspection. Having this data during the workover allows for immediate well design changes that can improve performance and potentially reduce operational expenses. There are several variables inherent in scanning at the wellsite that impact the accuracy of this inspection method. Some of these factors, such as the inspection equipment condition or inspector competence, can be accounted for through proper maintenance and calibration prior to each use or extensive training. Pulling speed, cleanliness, and alignment of the tubing through the scanning unit can all influence the measured indications and ultimately the classification of the material. Controlling these varying elements as much as possible is critical in producing quality results while on-site. Ultrasonic testing (UT) and pit-depth gauges can and should be used throughout the wellsite inspection to validate findings.
In-Facility Tubing Inspection
Transporting tubing into a specialized facility allows for a more comprehensive inspection along the entire length of the joint. The equipment commonly implemented in-facility includes EMI along with other inspection methods, such as eddy-current, mechanical gauging, visual methods, and UT. In this case, it is common for EMI sensors to contact the tubing outer diameter to improve the measurement of flux exiting the material. The eddy-current system uses a rotating head to improve detection of longitudinal defects. These inspection techniques allow for thorough end-to-end assessments that are pivotal in detecting subtle yet critical tubing imperfections, enabling a more comprehensive evaluation of tubing integrity. Assets brought into a facility can be inspected under optimal conditions and eliminate the environmental factors that influence wellsite inspection. Each joint can be cleaned, aligned properly, and rolled through the inspection equipment at a consistent speed to obtain superior inspection quality. The inspector is often in close proximity to the tubing when it is processed where indications are efficiently proven up with UT to quickly confirm readings following calibration or as needed. End area inspection is another benefit of material coming into a facility, where the portion of the tubing missed by the inspection equipment can be evaluated. This allows for identification of defects that might downgrade a joint or the ability to salvage a good tubing body by rethreading the connection. Although inspection results are not available typically until after the well work has been completed, good tubing is readily available for a subsequent well at a reduced expense and a properly managed tubing inventory can be established.
Evaluation
A series of field trials were conducted in 2021 to compare the inspection results of wellsite scanning to the in-facility process, using the latter method as the standard for evaluation based on the thoroughness provided. SPE-214823-MS, EMI Scanning Tubing at the Wellhead: What it is, What it isn’t, and is it Worth It, details this study evaluating multiple styles of inspection equipment and several inspection providers. The overall results of the trial identified that the wellsite scanning systems considered did not reliably provide accurate results when compared to the in-facility inspections. Wellsite scanning consistently rejected less tubing than the facility inspection in all but one well evaluated, potentially leading to the installation of unacceptable tubing and possible premature failure following repair. Further review of the wellsite systems found that some of the providers did not follow manufacturer guidelines for calibrating the equipment, which likely affected the accuracy of those tests.
Based on these findings, an in-facility tubing reclamation program was established as the standard practice in the Permian and Delaware assets. It was crucial to our operation that we correctly identify the tubing condition of any used material before reinstallation in a well. Although the reason for downgrade could more accurately be determined in a facility, the correlation to depth provided by tubing scanning was desired. This missing component is imperative to optimization of well designs across the field and a way to capture this critical piece was sought out. Through a series of trials, an innovative approach was developed to bridge this data gap, which incorporated a systematic numbering system implemented as tubing is laid down prior to transport to the inspection facility.
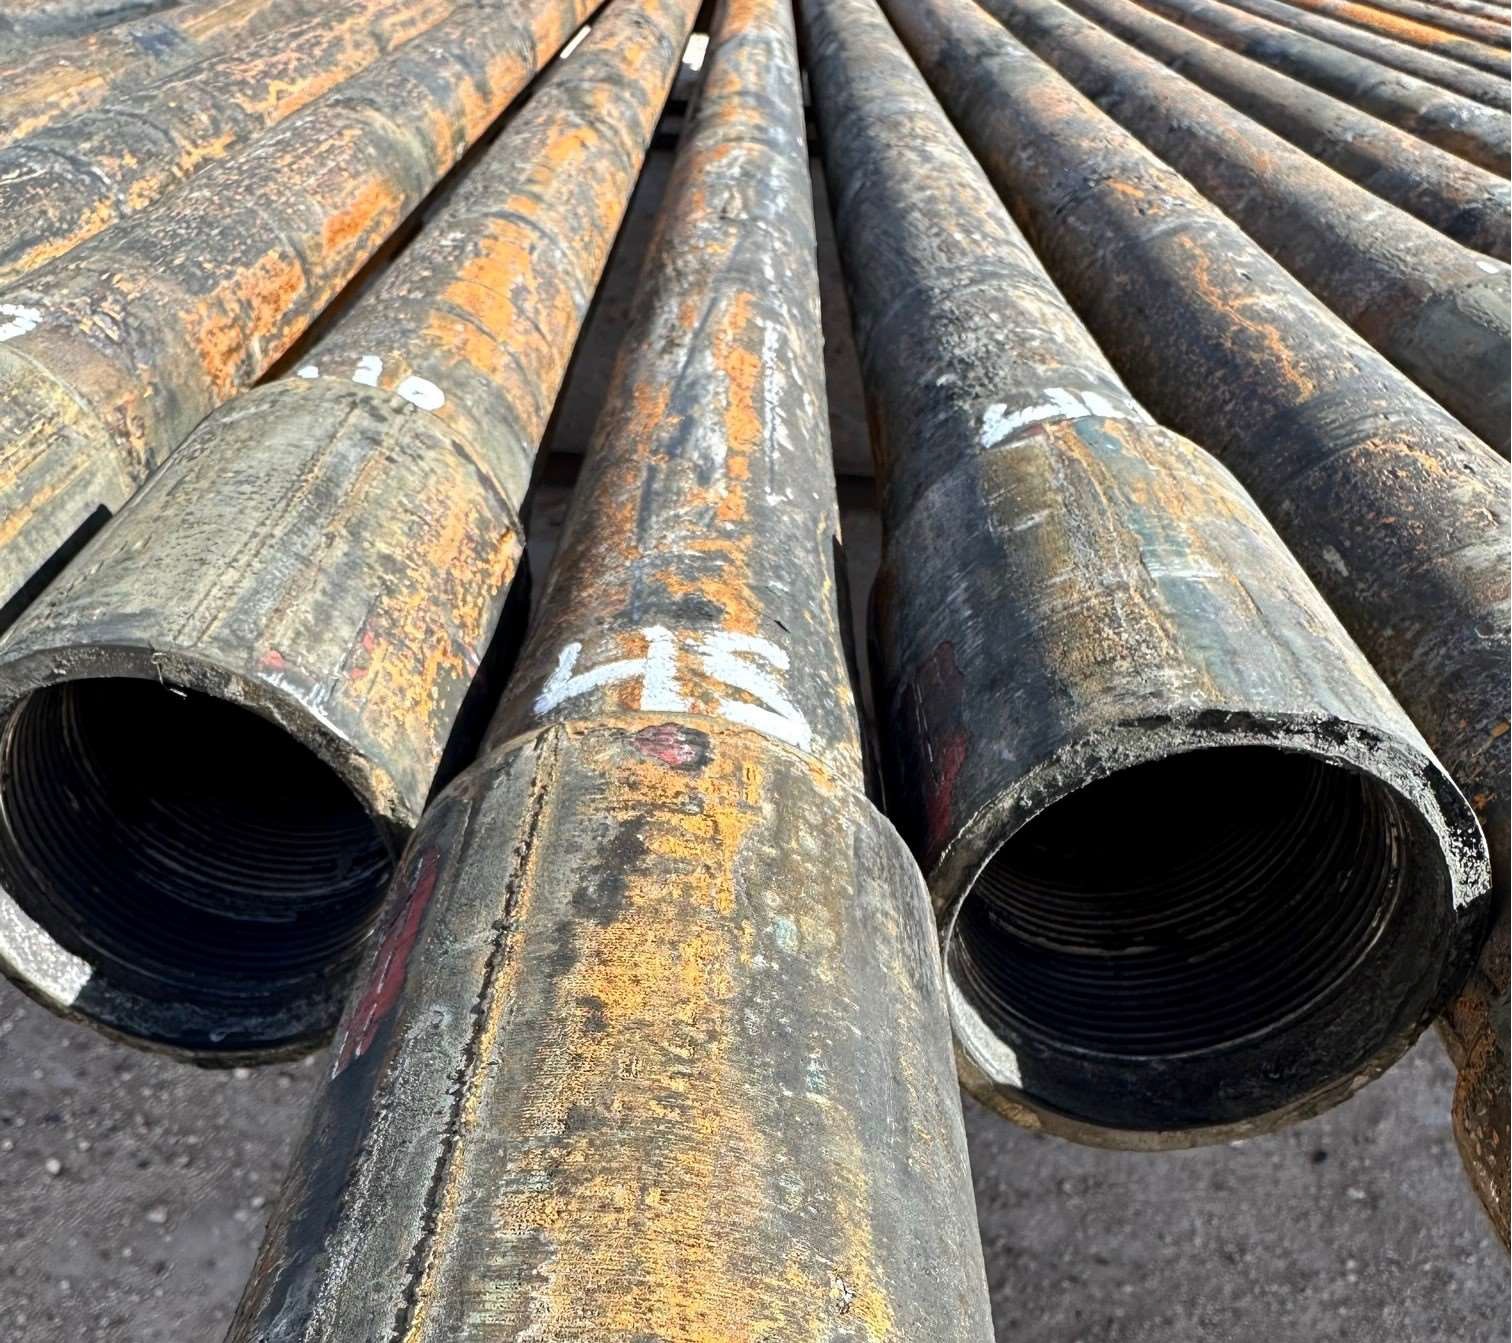
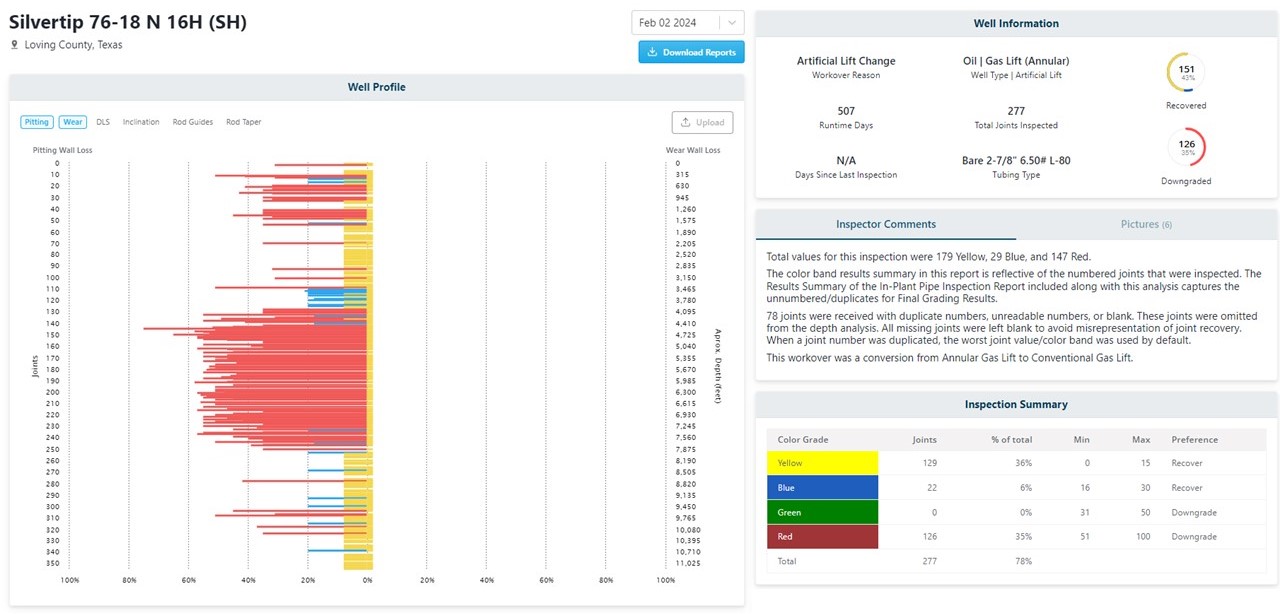
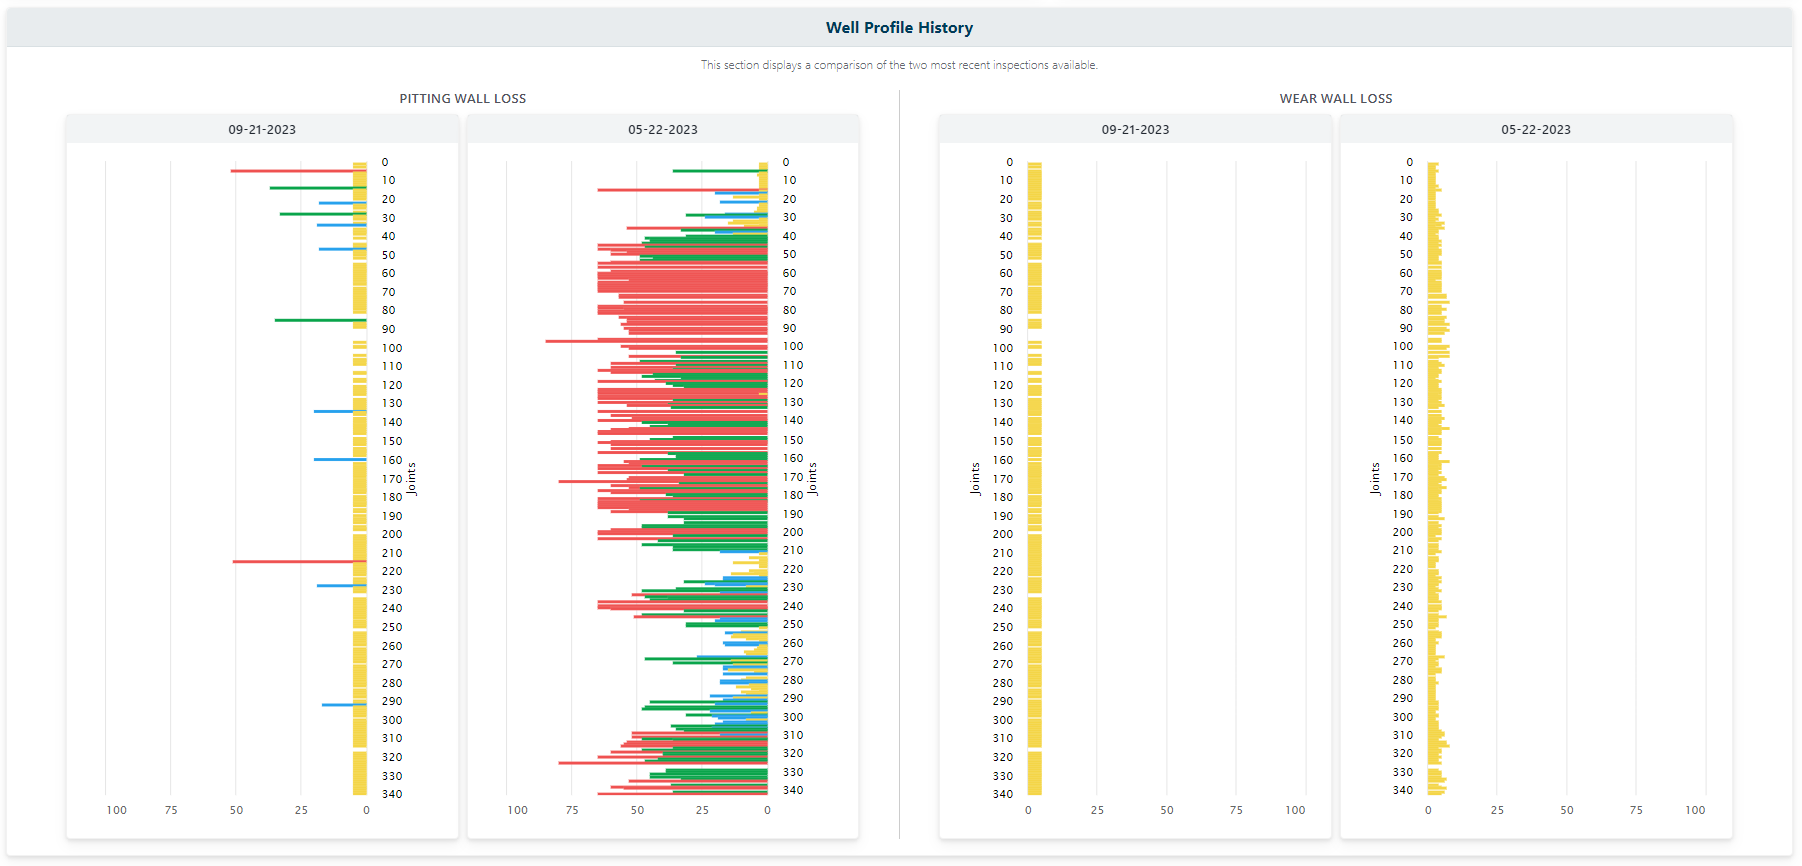
When tubing is pulled from the well it is racked out in sequence where it can be wiped clean of fluid and debris six to twelve inches from the collar. Each joint is labeled horizontally below the collar in order out of the well with a paint marker to ensure that the best data is captured once at the facility (see Figure 4). It is imperative that chalk is not used or labeling take place on the collar because it was discovered that these methods of identification yielded poor results following transport. These joint values are then captured at the facility as the asset is processed. Once the tubing has been inspected at the facility, the results of each joint are digitally rearranged according to the order they were pulled from the well. The result is a simulated depth-based inspection where the data is then used to create a well profile (see Figure 5). This useful graphical tool aids in downhole troubleshooting, failure analysis, and design optimization. All the inspection information is managed in a software database for streamlined access for all personnel involved in well operations. This platform serves as a historical archive where past data can be reviewed, allowing for side-by-side evaluation the next time the well goes down (see Figure 6). Through this process, in-facility inspections demonstrated that they could integrate some benefits traditionally exclusive to wellsite scanning. This development enhances the overall merits of in-facility inspections, establishing it as the preferred method.
Results
Through the conducted field trials comparing wellsite scanning to in-facility inspection, valuable information about specific conditions that significantly influence the outcome were discovered. The first well evaluated was a San Andres well approximately 5000 feet deep. It was chosen because it had a relatively short run time following a repair in December of 2020 where tubing was scanned prior to reinstallation. The subsequent failure was a tubing leak in April of 2021. When the tubing was scanned by both companies at the wellsite, neither piece of equipment was able to identify the hole but was visually located by the rig crew in the upset area during the second tubing pull. This validated the aforementioned limitation with wellsite scanning equipment and exposed the potential risk of putting this joint back down hole if it was not found visually. Any defect in the end area is restricted to visual inspection methods in less favorable conditions compared to facility-based inspection. It was also identified through this trial that iron sulfide could be interpreted by a wellsite scan as wall thickness. Both wellsite scans determined tubing joints 18-22 from surface to be either Yellow or Blue Band. Once this material was sent into the facility and cleaned properly, severe under deposit corrosion from iron sulfide was detected. It was determined that these wall thickness misinterpretations from iron sulfide deposits could give the impression that a joint was of good integrity. These same joints were downgraded to Red Band, greater than fifty percent wall loss, following the EMI in-facility (see Figure 7). Given the variance in tubing condition measured, it is likely that another diminished run time would have followed this well maintenance had the tubing been rerun following either wellsite scan. This well was returned to production with an entire string of Yellow Band tubing that had been previously inspected at a facility and ran for 762 days with minimal adjustment to the operating parameters, achieving four times that of the previous failure.
This well example is one of many that can be further reviewed in SPE-214823-MS, that ultimately led OXY to approach tubing inspections differently. Based on these findings it became a standard operating procedure to perform all tubing inspections at a specialized facility, allowing for the option to hydrotest on marginal well repairs. Revised hydrotesting pressures and best practices were developed in order to successfully complete an overhaul of the tubing reclamation program. Further analysis on eighty percent of yield or burst rating for J-55 and L-80 grade tubing led to different recommended pressures for hydrotesting procedures. Additionally, the hold time was increased to ten seconds per stand, to ensure adequate time for the tubing joints to hold pressure. It was discovered that when pressure was held for a shorter interval, it was difficult to distinguish between a joint that had actually burst, or the natural decline of pressure released. This change in procedure was warranted given some oversight on busted joints in the field. The new initiative of in-facility inspection is fundamental to the overhaul of OXY’s tubing reclamation program. The entire process is managed by a dedicated team at OXY, partnered with approved service providers. OXY maintains ownership of all material throughout the life of the asset, where credits can be issued directly back to the wells it came from based on the inspected condition. This process is seamless when partnering with an inspection company that specializes in asset management and can provide detailed reports digitally of each transaction throughout the facility. Any expense incurred by the well to run a new or inspected tubing string is reduced by the appropriate value of the previous string condition. Within the first year of this adjusted program, over $35MM had been issued in credit back to wells and a robust inventory of in-facility inspected Yellow and Blue Band material is available for installation.
Rig time savings was an additional benefit of implementing this revitalized inspection program. Reviewing two years’ worth of data suggested that setting up the wellsite scan equipment, calibrating properly, and pulling the tubing at a controlled speed added about one hour of rig time for a 5000 foot well. The average cost for rig time was approximately $1000 per hour, when accounting for the rig rate, reverse unit, blow out preventer rental, and other associated equipment rental expenses. Throughout 2022 and 2023 there were almost 2000 well repairs classified as having a “Tubing Leak” that would have resulted in a tubing scan rather than an in-facility inspection. This represents an estimated $2MM cost reduction over a two-year period, using a conservative approach of one hour rig time saved on a 5000 foot well. Any well deeper than this would equate to even more meaningful savings.
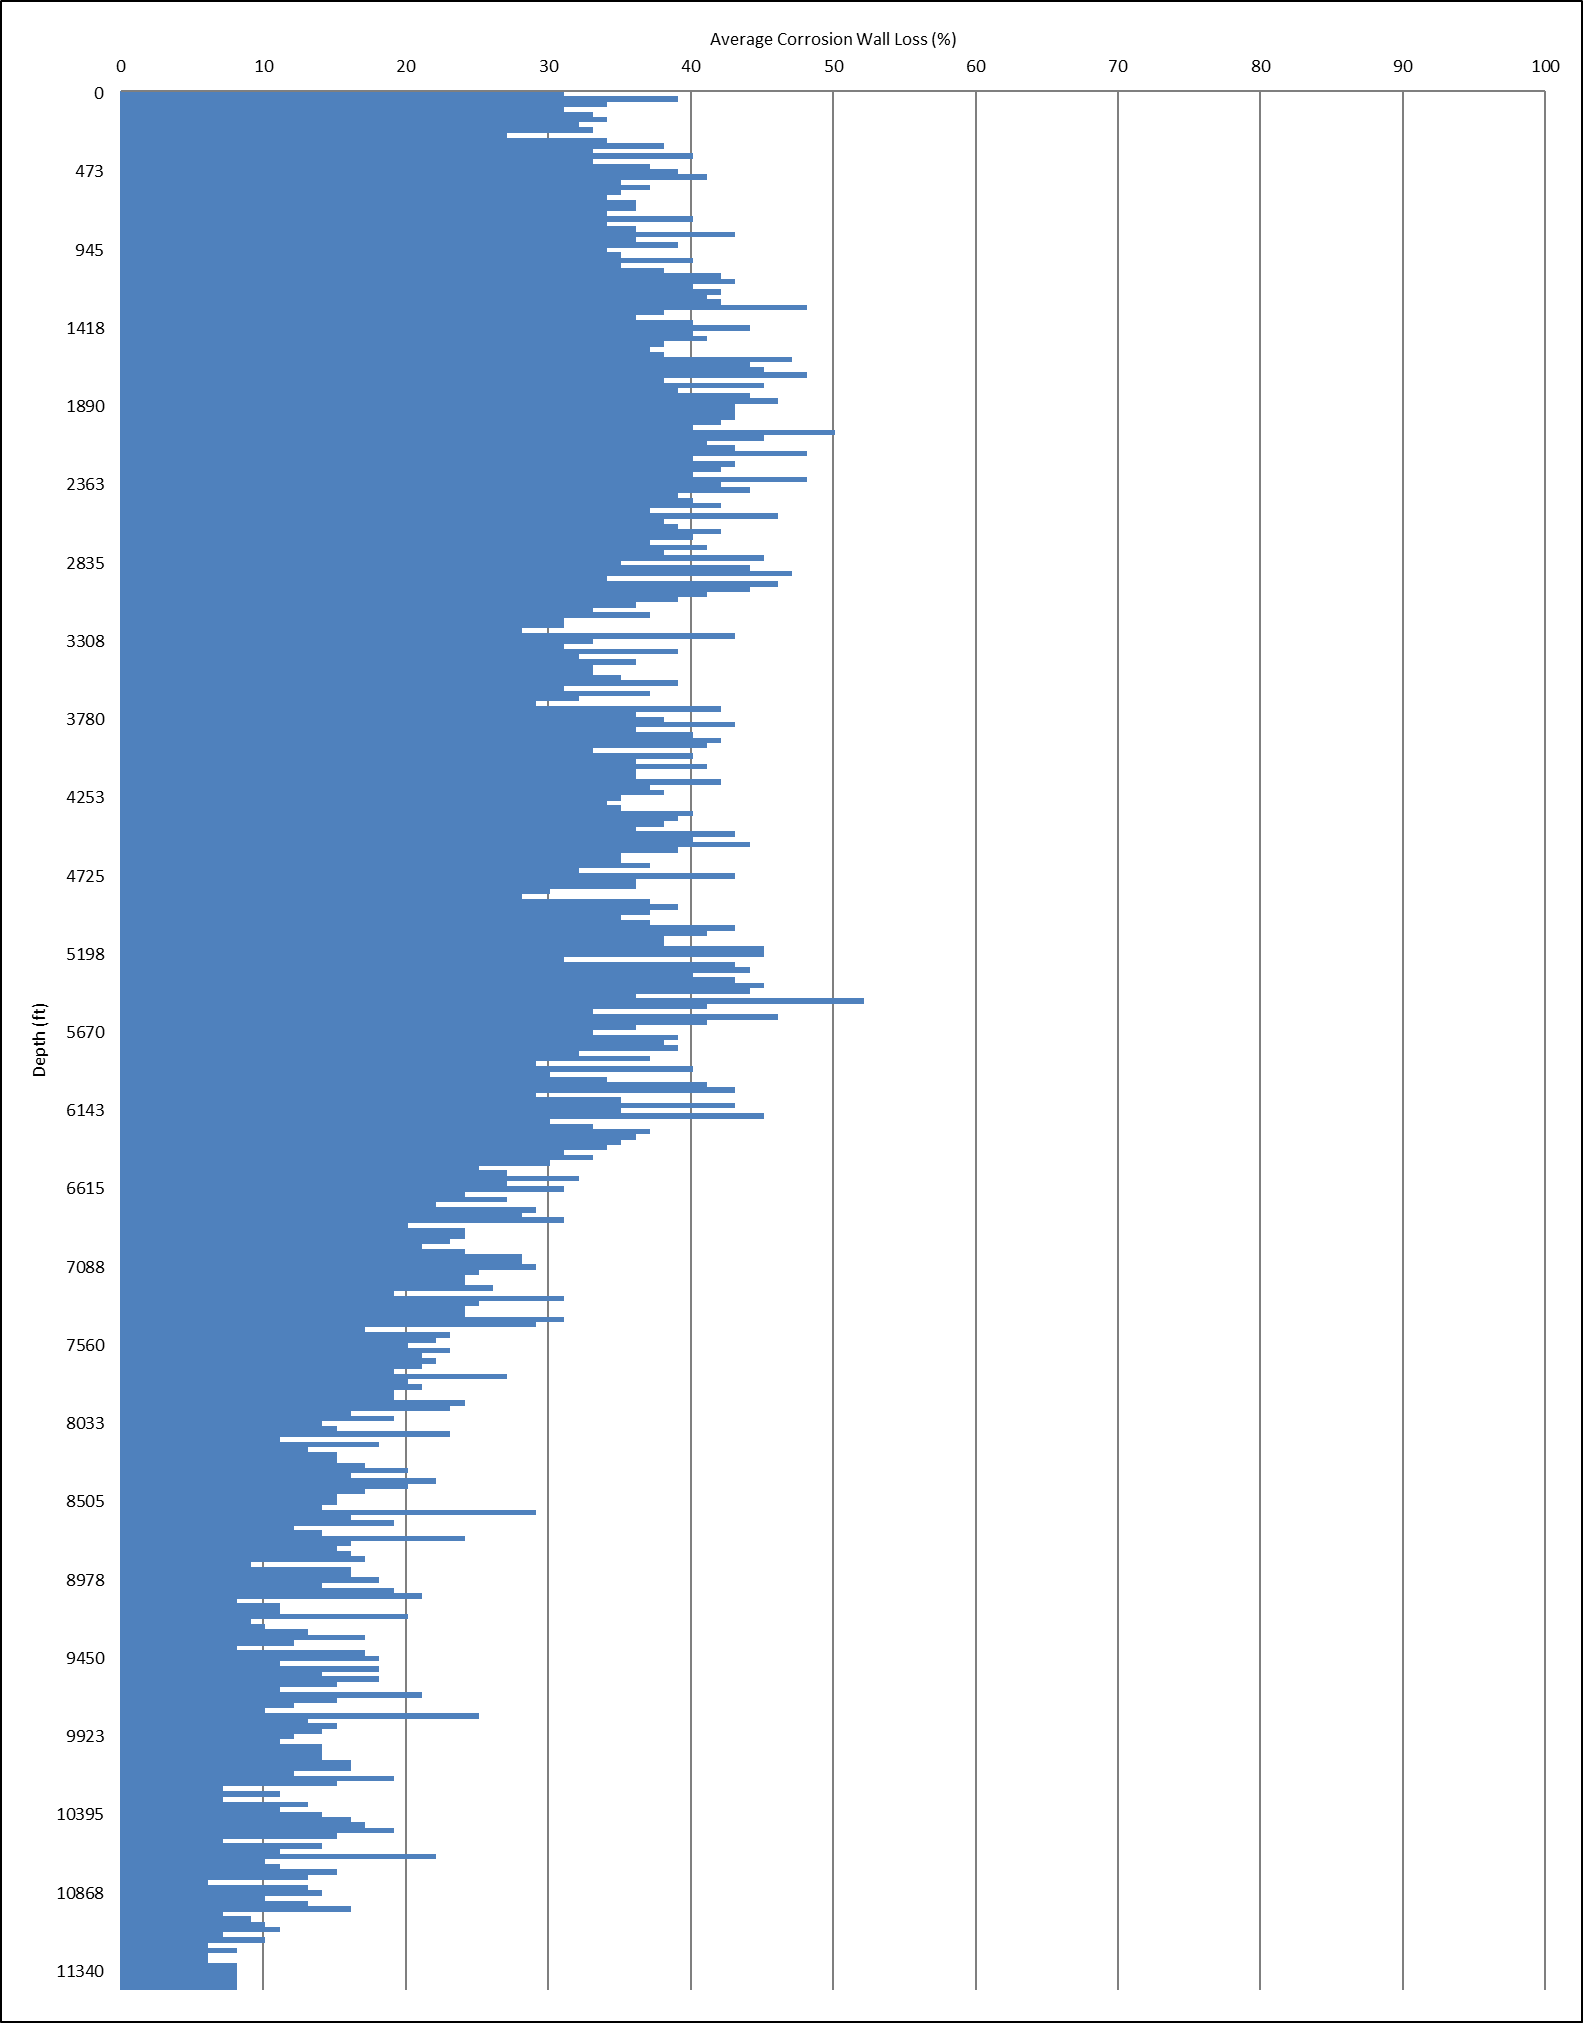
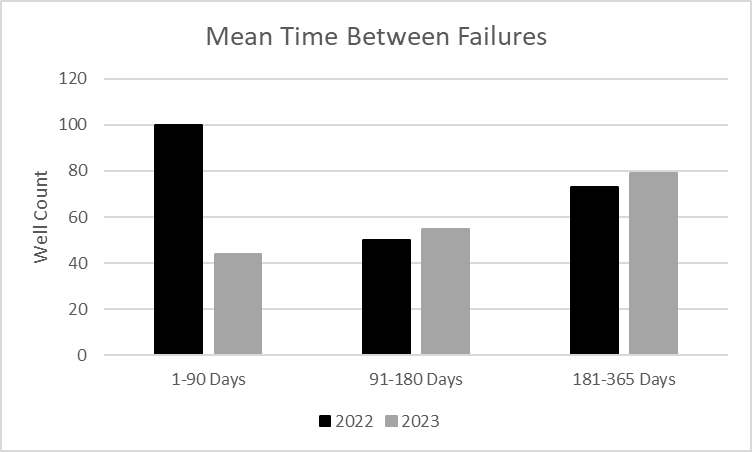
The ability to include depth correlation with in-facility inspection has provided a method to improve well designs using data trends in the entire well profile. This has provided valuable insight when optimizing sucker rod pumped wells showing significant tubing wear even though the high-resolution well survey may not have provided an indication of dog-leg severity in that area. The depth analysis capabilities of these inspections allow for improved run times between well failures when using the results to better design guide configurations in sucker rod pumped wells to mitigate wear. Not only has this adoption benefited wells operating on rod lift but it has also highlighted a recurring issue in annular flow gas lift wells. Through the thorough inspection process, consistent corrosion on the outer diameter of the tubing has been discovered due to high fluid velocities, erosion, and turbulent fluid dynamics (see Figure 8). This occurs predominantly in the areas where the capillary tubing for chemical treatment is clamped. Data modeling is easily comparable with field results when depth correlated inspections identify where lifting is taking place in the wellbore. A positive downward trend in tubing failures occurring within 90 days of a previous tubing failure was achieved through integration of this approach, resulting in more than a fifty percent decline year over year in wells failing in this time interval (see Figure 9). This is directly associated to the improved tubing integrity when installing assets back into a well.
Conclusions
The implementation of in-facility tubing inspection paired with depth correlated analysis has proven effective when evaluating tubing data against a well profile. Relying on this data integration will allow for enhanced measurement of optimization initiatives to mitigate failures as the reclamation program continues. Substantial inspected tubing inventory, monetary credit allocations back to the well supplying the material, and rig time savings are all positive outcomes of this approach. Revisions to existing standard operating procedures to cultivate optimum success during intervention with tubing integrity has been an additional byproduct. A thorough inspection at the facility with depth correlation has proven to provide accurate data to adjust well design and operation, which has led to an increase in well run time.
References
API RP 5C1 Recommended Practice for Care and Use of Casing and Tubing
SPE-214823-MS EMI Scanning Tubing at the Wellhead: What it is, What it isn’t, and is it Worth It
Moore and Stanley 2012 Moore, D.G. and Stanley, R. K. 2012. Magnetic Particle and Flux Leakage Testing. In Nondestructive Testing Overview, third edition, ed. G. L. Workman and P. O. Moore, Chap. 9, 274–311. Columbus, Ohio, USA: Nondestructive Testing Handbook Series, Vol. 10, The American Society for Nondestructive Testing.
Acknowledgements
Thank you to the SWPSC for allowing us the honor of contributing to this year’s publication and presentation offering. This would not have been possible without the input from key individuals at OXY and RTS. We greatly appreciate your support in our efforts to positively impact our industry.